The Pi Cycle Top is one of the most watched indicators in Bitcoin onchain analysis. It has called every major Bitcoin cycle top since 2013 with striking precision. In some cases, within a single day of the actual peak.
If you have never heard of it, or you are hearing “Pi Cycle Top” thrown around in crypto Twitter and want to understand what it actually measures, this is the full breakdown.
What Is the Pi Cycle Top?
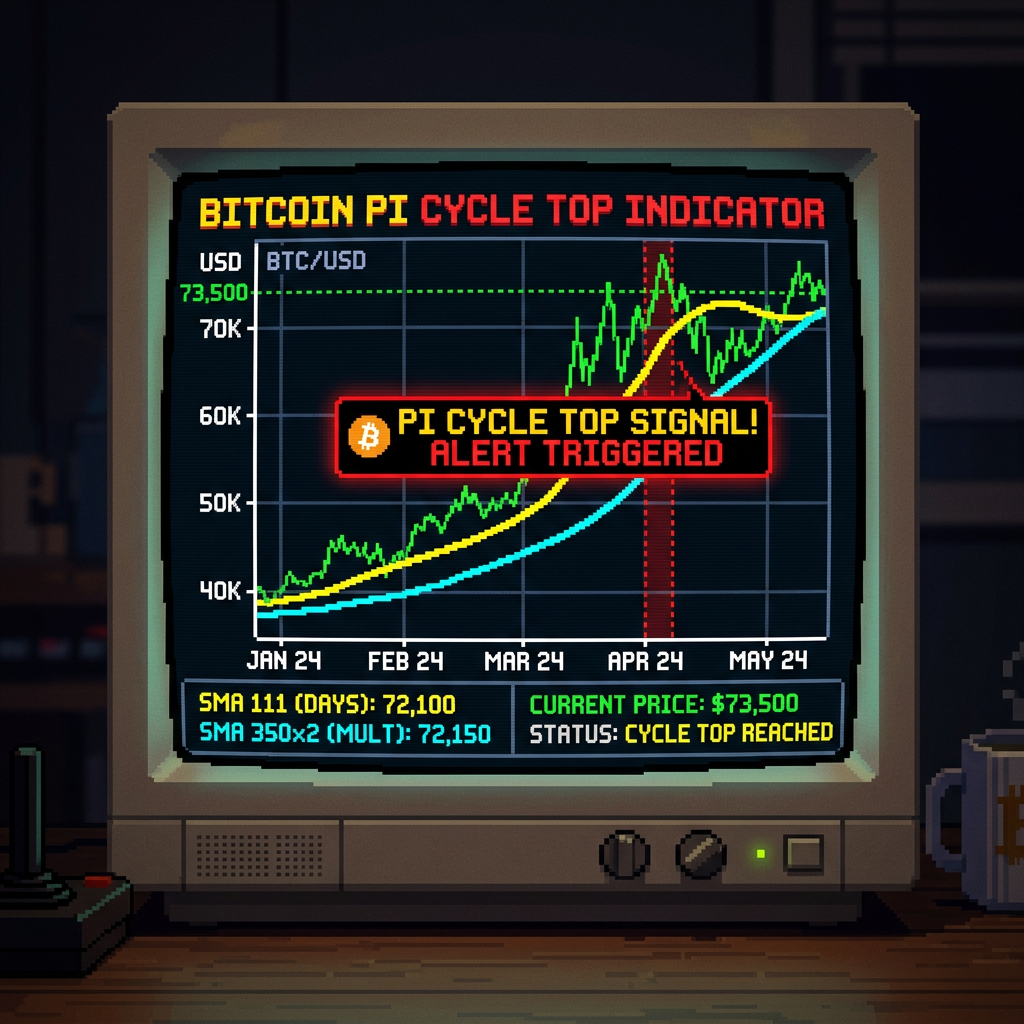
The Pi Cycle Top is a Bitcoin price indicator that uses two specific moving averages to identify when Bitcoin is likely approaching a cycle top. When these two moving averages converge and cross, history shows that Bitcoin has been at or very near its cycle peak.
The two moving averages are:
- 111-Day Moving Average (111DMA): The average closing price of Bitcoin over the last 111 days
- 2x 350-Day Moving Average (2x350DMA): The 350-day moving average multiplied by two
The signal fires when the 111DMA crosses above the 2x350DMA. That crossing has historically coincided with Bitcoin cycle tops.
The name “Pi Cycle” comes from the ratio between the two periods: 350 divided by 111 equals approximately 3.153, which is close to the mathematical constant pi (3.14159…).
The Historical Track Record
The reason traders and analysts pay attention to this indicator is simple: its historical accuracy is exceptional.
2013 Cycle Top
Bitcoin peaked in late November 2013 at around $1,163. The Pi Cycle Top signal triggered within days of that peak. Price data from 2013 has limitations, but the signal was present in hindsight backtesting.
2017 Cycle Top
Bitcoin peaked at approximately $19,666 on December 17, 2017. The Pi Cycle Top indicator fired on December 18, 2017, one day after the actual peak. The two moving averages crossed with a precision that surprised even veteran analysts watching in real time.
2021 Cycle Top
Bitcoin hit its first 2021 peak in mid-April 2021 at approximately $63,500 to $64,800. The Pi Cycle Top signal fired on April 12, 2021, just days before the peak. Bitcoin dropped roughly 55% from that level over the following weeks before recovering. Bitcoin later made a new all-time high near $69,000 in November 2021, but the April 2021 signal was the cleaner, more decisive Pi Cycle Top reading.
Across these data points, the indicator has not given a confirmed false positive signal. It has not fired when Bitcoin was nowhere near a top. That track record is what gives it credibility.
Why These Specific Moving Averages?
The indicator was developed by Philip Swift of Look Into Bitcoin and DecenTrader. The choice of 111 and 350 was not arbitrary. Swift identified these periods through backtesting as the moving average pairing that most reliably flagged Bitcoin cycle tops historically.
The 111DMA is short enough to react to cyclical price momentum. The 350DMA represents roughly one year of trading, smoothing out shorter-term noise. Multiplying the 350DMA by two brings it up to the level where Bitcoin price has tended to be at maximum cycle overheating.
When the shorter-term 111DMA catches up to and crosses the long-term 2x350DMA, it signals that Bitcoin’s recent momentum has pushed price so far above its long-run average that, historically, the top is in or very near.
What the Pi Cycle Top Is Showing Right Now (April 2026)
As of April 2026, Bitcoin is trading around $78,000, recovering from the Q1 2026 correction that brought it from its all-time high near $108,000 down to lows around $75,000.
The Pi Cycle Top is not signaling a top.
The 111DMA is significantly below the 2x350DMA. The two moving averages are not close to converging. For the Pi Cycle Top to fire, Bitcoin would need to sustain a significant move higher for an extended period, pushing the 111DMA up toward the 2x350DMA level.
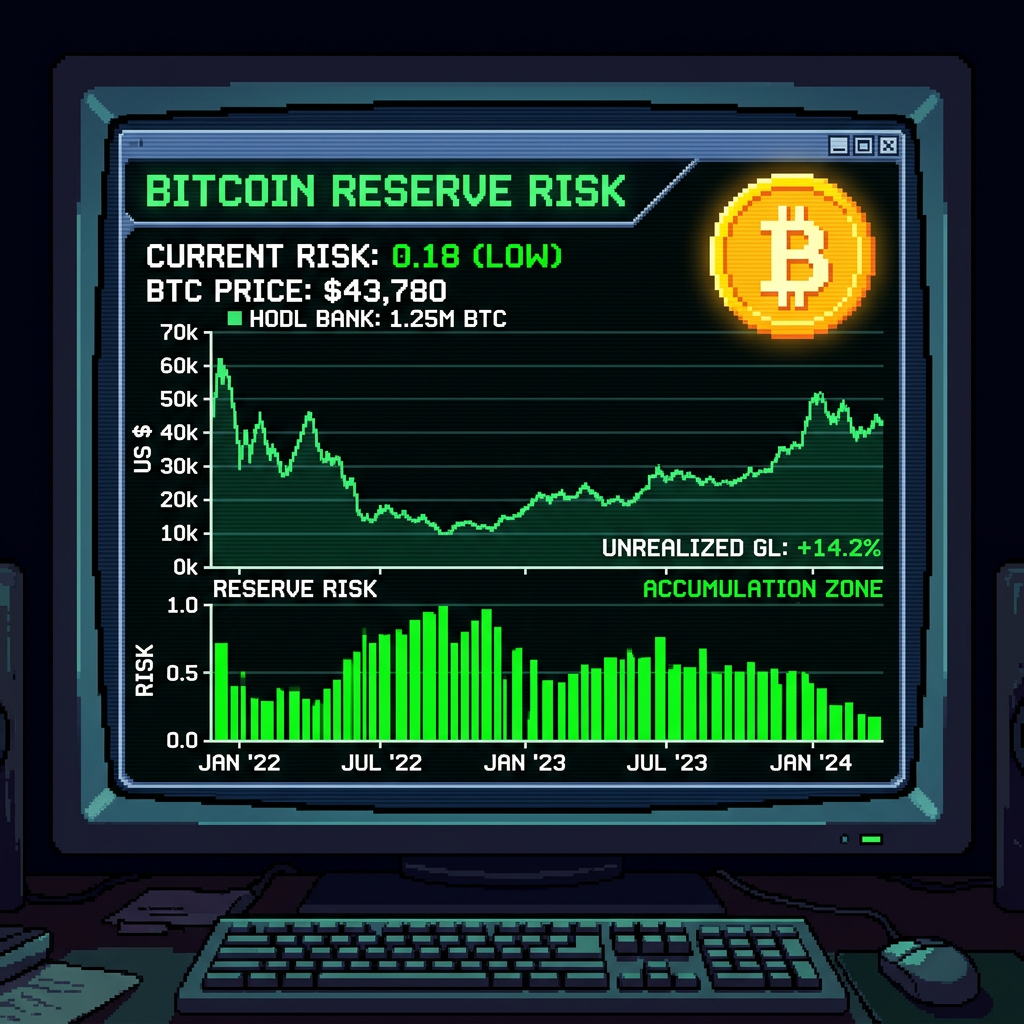
This is consistent with the broader onchain picture. The MVRV Z-Score is still in the value zone, not the overheating red zone where prior cycle tops occurred. RHODL Ratio readings remain subdued. Exchange reserves are near multi-year lows. The full cycle top indicator suite is not flashing the convergence that marked the 2017 and 2021 peaks.
The Pi Cycle Top is one of several indicators pointing in the same direction: this cycle has not topped.
How to Use the Pi Cycle Top in Practice
Watch for convergence, not just the cross
By the time the 111DMA and the 2x350DMA actually cross, you may already be near the top. The more actionable signal is watching them converge. When the gap between the two moving averages starts narrowing rapidly during a bull run, that is the early warning phase.
Use it alongside other indicators
No single metric is sufficient. The Pi Cycle Top works best as one component of a broader dashboard. Check it alongside MVRV Z-Score, RHODL Ratio, Realized Price deviation, and exchange reserves. Convergence across multiple signals is more reliable than any one firing alone. The 5-metric weekly dashboard is a good place to start building that habit.
It gives a sell signal, not a buy signal
The Pi Cycle Top only tells you when a top is near. It does not give accumulation signals at bottoms. For identifying cycle lows, use different tools: MVRV Z-Score in the green zone, Realized Price approaching spot price, or suppressed SOPR readings. The Pi Cycle Top is one-directional by design.
Monitor it for free
The Pi Cycle Top is available for free on LookIntoBitcoin.com and Glassnode. You do not need a paid subscription to track this indicator. Check it weekly during a bull market. When the moving averages are far apart, you have time. When they start converging, pay close attention.
Limitations of the Pi Cycle Top
Small sample size. The indicator has only fired cleanly at a handful of cycle tops. Three to four confirmed data points is a limited statistical base. Past performance does not guarantee future results.
Bitcoin’s cycles may be lengthening. As market cap grows and institutional participation increases, Bitcoin’s cycles may extend. A longer cycle could mean the Pi Cycle Top fires later relative to the actual peak, or at a higher price level than historical patterns suggest.
It is a lagging indicator. Moving averages react to price history. They cannot predict the future. The Pi Cycle Top tells you price has reached historically extreme levels relative to its long-run average. It does not guarantee price will fall from that level, only that it has historically.
It says nothing during bear markets. Once the signal fires, the Pi Cycle Top has no further value until the next cycle. It will not tell you when to accumulate or how deep the correction will go.
The Bottom Line
The Pi Cycle Top is a simple, elegant indicator with a remarkable track record. Two moving averages. One cross. Every major Bitcoin cycle top signaled.
In April 2026, the indicator is nowhere near signaling a top. The 111DMA and the 2x350DMA are not converging. The structural inputs that have historically marked cycle peaks are absent.
Add it to your weekly checklist. When the gap starts closing during a sustained rally, start paying attention to the full indicator suite. When the cross happens, history says you are near the end of the cycle.
Not a prediction. Just what the data has shown, cycle after cycle.


Leave a Reply