Most Ethereum investors watch price. Fewer watch what is happening beneath the surface: how many validators are entering the network, how many are exiting, and what the flow of staked ETH signals about where conviction is moving.
ETH staking flows are one of the cleaner behavioral indicators available for Ethereum. When staking deposits accelerate, long-term capital is locking up supply. When withdrawals spike, something has changed in how validators assess their risk-reward. Neither move is random. Both are worth understanding.
How ETH Staking Works
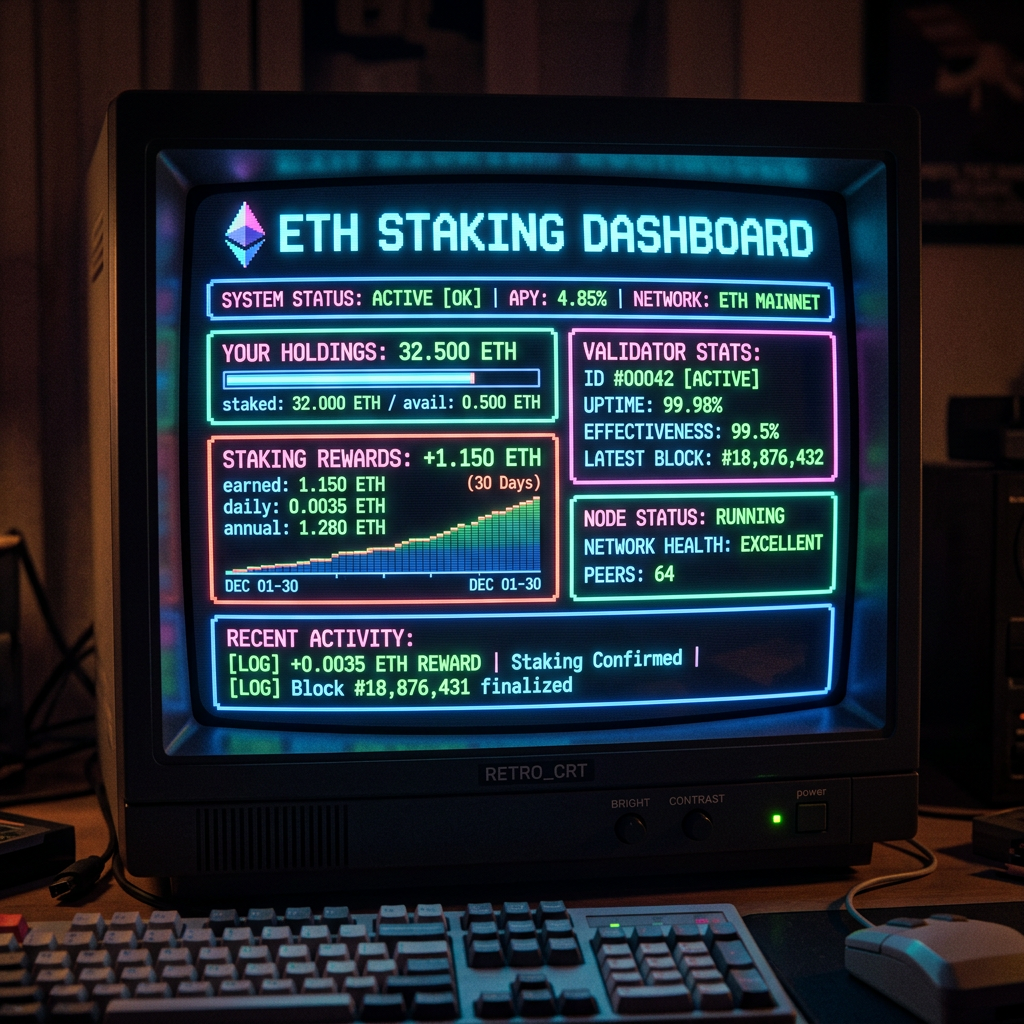
Ethereum transitioned from proof-of-work to proof-of-stake in September 2022 with The Merge. Since then, validators have secured the network by depositing 32 ETH into the Beacon Chain in exchange for staking rewards. As of May 2026, more than 34 million ETH is staked, representing roughly 28% of total circulating supply.
Validators earn a native yield, currently in the range of 3-4% annually, paid in newly issued ETH. That yield fluctuates based on total ETH staked: the more validators participate, the more that reward is diluted across the network.
What matters from an onchain perspective is not just the staking rate itself, but the direction and velocity of change. Staking flows are the signal inside that number.
The Deposit Queue: When Capital Wants In
When new validators want to join the network, they enter a deposit queue. Ethereum enforces a churn limit, meaning only a certain number of validators can activate per epoch (roughly every 6.4 minutes). At peak demand, this queue can stretch to days or even weeks.
A long deposit queue is a bullish signal for Ethereum. It means capital is actively seeking to lock up ETH for extended periods. Validators who stake are making a commitment: their ETH is not on an exchange, not available for quick sale, and earning yield through the network instead.
The deposit queue expanded rapidly during the 2024 and early 2025 bull run, with wait times exceeding two weeks at peak congestion. That kind of demand signals institutional and sophisticated retail interest in ETH as a yield-bearing asset, not just a speculative trade.
The Exit Queue: Reading Withdrawal Pressure
EIP-4895, implemented in the Shanghai upgrade in April 2023, introduced voluntary withdrawals. For the first time, validators could exit the Beacon Chain and retrieve their staked ETH. Before Shanghai, staked ETH was locked indefinitely with no exit mechanism.
The exit queue operates on the same churn limit as the entry queue. When a large number of validators signal their intent to exit, they line up and wait. A large exit queue is worth paying attention to, though context matters.
Not all exits mean selling pressure is coming. Many withdrawals are immediately re-staked, particularly by institutional staking providers rotating between validators or upgrading their infrastructure. The key distinction is between partial withdrawals (where validators collect accumulated rewards without exiting) and full withdrawals (where the principal 32 ETH is unlocked and returned to the validator’s wallet).
Full withdrawal spikes following sharp price increases tend to indicate profit-taking. Exits during price drawdowns tend to reflect forced deleveraging or validators choosing to exit while still in profit before conditions worsen.
Net Issuance and the EIP-1559 Burn
Ethereum’s post-Merge supply mechanics introduced something that did not exist under proof-of-work: the potential for net deflationary issuance. Every transaction on Ethereum burns a portion of the base fee, established by EIP-1559 in August 2021. Since the Merge reduced new ETH issuance by approximately 90%, periods of high network activity can result in more ETH burned than issued.
This dynamic creates a direct link between network usage and supply. When DeFi activity, NFT trading, or any other on-chain demand spikes, gas fees rise, the burn rate increases, and net issuance contracts. During low-activity periods, Ethereum issues ETH net of burns, creating modest inflation.
Tracking the burn rate relative to issuance gives investors a real-time picture of whether ETH supply is expanding or contracting. In bull market conditions, when on-chain activity is high, ETH has historically run deflationary for extended periods.
Validator Count as a Decentralization Signal
Beyond the flow of ETH in and out of the Beacon Chain, the total active validator count matters for a different reason: it is a measure of how decentralized Ethereum’s consensus layer is.
As of May 2026, Ethereum has more than 1.1 million active validators. That number has grown steadily since The Merge. A rising validator count indicates that staking participation is expanding, which distributes consensus power across more independent operators. A falling count could signal capital flight or centralization risk as smaller operators exit.
The composition of validators also matters. Lido, the largest liquid staking protocol, controls a significant share of staked ETH. The concentration of stake in a single provider is a known risk vector for Ethereum’s consensus layer. Watching whether that share is growing or shrinking is a useful secondary signal within staking flow data. The broader ETH onchain activity picture includes exchange reserves and gas usage alongside staking flows for a complete view.
Staking Rate and Supply Lock-Up
The staking rate, expressed as a percentage of total ETH supply locked in validators, is one of the most direct supply signals available for Ethereum. With roughly 28% of supply staked as of mid-2026, a substantial portion of ETH is structurally removed from circulation.
Unlike Bitcoin exchange reserves, where supply leaves exchanges gradually, ETH staking is a formal, protocol-level commitment. Staked ETH cannot be moved, sold, or transferred until a withdrawal is processed. This makes the staking rate a hard constraint on available supply, not a behavioral estimate.
When the staking rate rises, the float of freely tradable ETH contracts. When it falls, it can signal that validators are rotating out or that confidence in the protocol’s yield has declined. Historically, the staking rate has trended upward since The Merge, with only brief reversals during periods of macro uncertainty.
How to Read Staking Flows as a Market Signal
Taken together, these metrics form a framework for reading Ethereum’s behavioral layer:
- Rising deposits and a long entry queue: Capital seeking long-term exposure. Structurally bullish for ETH supply.
- Rising exits and a growing exit queue: Validators rotating out. Context matters: if price is elevated, it may be profit-taking. If price is depressed, forced exits are more likely.
- Burn rate exceeding issuance: Net deflationary supply. Strongest during high on-chain activity periods.
- Rising validator count: Growing participation, healthier decentralization, growing network confidence.
- Rising staking rate: Supply lock-up increasing. Less ETH available for exchange selling.
No single metric tells the whole story. But when deposits are rising, validator count is growing, and the burn rate is outpacing issuance, the structural picture for ETH supply is tightening. That combination has historically preceded ETH price expansion.
Current Readings: May 2026
As of May 2026, Ethereum’s staking picture remains constructive. The deposit queue is active but not overloaded. Net exits remain modest relative to total validator count. Exchange reserves for ETH remain near multi-year lows, a trend covered in depth in the Ethereum onchain activity explainer. The burn rate has been tracking above zero net issuance during periods of elevated DeFi and L2 settlement activity.
What this adds up to: the supply side for Ethereum is not under stress. Validators are not exiting in unusual numbers. Capital is not rotating out. The staking rate is stable. These are baseline conditions, not a catalyst. But they are the backdrop against which any price event for ETH should be read.
Where to Track ETH Staking Data
Several free tools provide high-quality staking flow data for Ethereum:
- Beaconcha.in: the most comprehensive Beacon Chain explorer. Live validator count, entry and exit queue depth, reward rates, and individual validator tracking.
- Rated.network: validator performance data, staking provider concentration, and network health metrics.
- Ultrasound.money: real-time ETH supply, burn rate, issuance, and net deflationary or inflationary status.
- Glassnode: staking flow data including net deposits, withdrawals, and staking rate trends over time. Lite tier is available free.
For a broader onchain view that integrates staking data with price behavior, gas usage, and exchange reserve trends, the full Ethereum onchain activity breakdown covers the complete picture.
The Bottom Line
ETH staking flows are not the loudest signal in crypto. They do not spike and collapse on a daily basis. But they are one of the most structurally informative datasets available for Ethereum investors.
When long-term capital is locking up ETH through staking, when the burn is running above issuance, and when validators are not exiting at unusual rates, Ethereum’s supply picture is tightening. That backdrop matters. Understanding it means you are reading something most market participants are not.


Leave a Reply