Bitcoin’s SOPR family is one of the most useful frameworks in onchain analysis. One metric. Four versions. Each revealing a different slice of who is buying, selling, and at what price.
Most investors know SOPR in some form. Far fewer understand the difference between aSOPR and bSOPR, or why that distinction matters for reading market cycles.
This post covers both: what they measure, how they diverge, and what the current readings are telling you.
What Is SOPR?
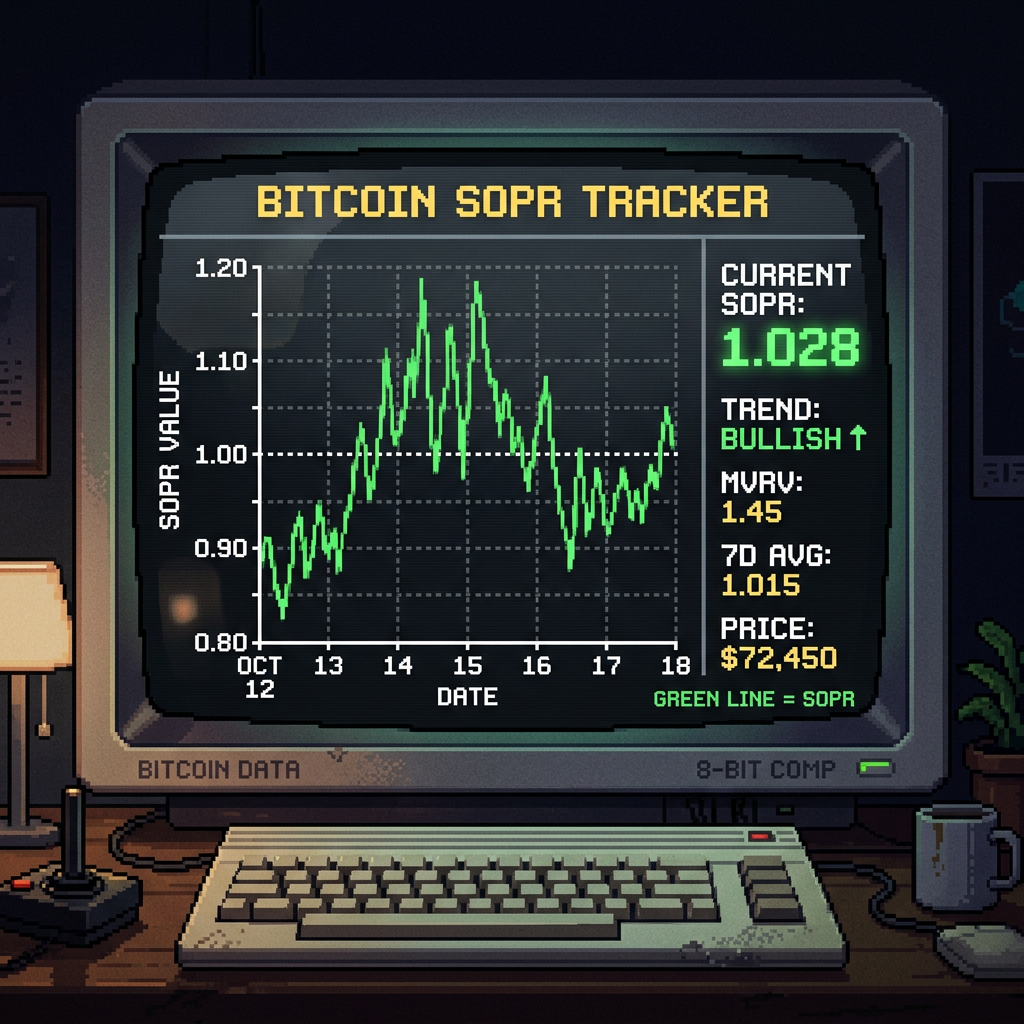
SOPR stands for Spent Output Profit Ratio. It measures the profit or loss embedded in each Bitcoin transaction by comparing the price at which a coin was last moved to the price at which it is being spent now.
The formula: SOPR = selling price divided by purchase price.
- Above 1.0: the coins being moved are in profit on average
- Below 1.0: the coins being moved are at a loss on average
- At 1.0: the market is at break-even, often a critical decision point
When SOPR crosses above 1.0 after a sustained period below it, that has historically marked structural shifts from fear to recovery. When it peaks well above 1.0 and begins falling, it has often marked cycle tops.
The raw SOPR includes a lot of noise, particularly from exchange wallet sweeps, consolidations, and coins moved and spent within the same hour. That is where aSOPR and bSOPR come in.
What Is aSOPR (Adjusted SOPR)?
aSOPR is the adjusted version of SOPR. The adjustment is simple but meaningful: it removes all UTXOs (unspent transaction outputs) that were spent within one hour of being created.
This single filter cleans up a large portion of the noise in raw SOPR. Exchange wallet consolidations, internal transfers, and dust movements all tend to happen within short time windows. By removing these, aSOPR gives a cleaner picture of economically meaningful spending behavior.
What aSOPR tells you:
- It reflects the behavior of the broader Bitcoin market, not just short-term exchange mechanics
- When aSOPR crosses above 1.0 after a sustained sub-1.0 period, the average coin being spent is now in profit: a structural shift signal
- Consistent readings above 1.0 correspond with early-to-mid bull market conditions
- Sustained readings below 1.0 correspond with bear market conditions and capitulation pressure
In Q1 2026, aSOPR spent the majority of the quarter below 1.0. BTC fell from $108,000 to $75,000 during that stretch. The first sustained aSOPR cross above 1.0 came in early April, coinciding with BTC’s recovery toward $78,000. That cross is one of the cleaner structural signals this cycle. For full context on what those Q1 readings looked like, see the Bitcoin Q1 2026 Onchain Review.
What Is bSOPR (SOPR by Holder Type)?
bSOPR refers to SOPR segmented by holder cohort: specifically, the distinction between short-term holders (STH-SOPR) and long-term holders (LTH-SOPR).
Onchain analytics platforms use the 155-day threshold as the dividing line. A coin held for fewer than 155 days before being spent is classified as a short-term holder (STH) output. A coin held for more than 155 days is classified as a long-term holder (LTH) output.
This segmentation produces two signals with fundamentally different behavior patterns.
STH-SOPR: Short-Term Holder SOPR
STH-SOPR tracks whether coins bought recently are being spent at a profit or loss. It is reactive and volatile. Short-term holders tend to panic during price drops and sell into strength.
When STH-SOPR drops well below 1.0 for an extended period, it signals that recent buyers are sitting on losses and may be approaching capitulation. When it crosses back above 1.0, it means recent buyers are breaking even: a classic early recovery signal.
In Q1 2026, STH-SOPR was below 1.0 for eight consecutive weeks. That is consistent with the structural profiles of past cycle lows. For a deeper look at STH-SOPR mechanics and how to read the crossover, the STH-SOPR explainer here covers the historical precedents in detail.
LTH-SOPR: Long-Term Holder SOPR
LTH-SOPR tracks whether coins held for more than 155 days are being spent at a profit or loss. It is slower-moving and more significant when it does move.
Long-term holders represent the highest-conviction segment of the market. They have held through drawdowns. They are not easily shaken out by volatility. When LTH-SOPR spikes significantly above 1.0, it signals that long-term holders are distributing into strength, typically at or near cycle tops.
In December 2017 and November 2021, LTH-SOPR spiked sharply before both market peaks. Right now, LTH-SOPR is calm. The cohort is holding. There is no LTH-driven distribution signal active in the current data.
aSOPR vs bSOPR: How to Use Them Together
These metrics work best when read in combination.
aSOPR gives you the aggregate picture: is the broad market spending at profit or loss? It is the fastest and cleanest starting point for reading market structure.
bSOPR (the holder-type breakdown) gives you the reason behind the aggregate reading. An aSOPR cross above 1.0 driven by STH behavior is less durable than one where LTH-SOPR is also constructive. Conversely, if aSOPR is rising but LTH-SOPR is spiking hard, that is often distribution.
The most useful signal combination to watch:
- aSOPR crosses above 1.0: market-wide recovery signal, noise filtered out
- STH-SOPR crosses above 1.0: recent buyers breaking even, capitulation pressure releasing
- LTH-SOPR calm, not spiking: no distribution from long-term holders
That three-part alignment has historically marked structural shifts from bear to bull phases, not local bounces. Right now, the SOPR family is in early-stage recovery territory. The MVRV Z-Score is pointing in the same direction, and the two metrics read as a pair are more reliable than either alone.
For a broader weekly framework that incorporates SOPR alongside other key onchain metrics, the Bitcoin Onchain Dashboard shows how to run a structured weekly check.
Current Readings and What to Watch Next
With BTC at $77,881 and up 2.4% in the last 24 hours, the SOPR family is worth monitoring closely at this level.
Three things to track over the coming weeks:
Can aSOPR hold above 1.0 on pullbacks? A confirmed hold through price dips would signal that the structural shift is real, not a dead-cat bounce. If aSOPR drops back below 1.0 on a $3,000-5,000 correction, the recovery signal resets.
Does STH-SOPR build a base above 1.0? Extended sub-1.0 stretches followed by confirmed crossovers are where cycles have historically accelerated. Eight weeks below 1.0 in Q1 is a long base. The crossover matters more when it sustains.
Does LTH-SOPR remain calm? If it starts spiking meaningfully above 1.0 at higher price levels, that is the signal to watch for distribution, not accumulation. Currently it is quiet. That is structurally positive.
The SOPR family does not predict price. What it does is confirm or contradict the narrative. Right now, the narrative is recovery. The data is starting to agree.


Leave a Reply