
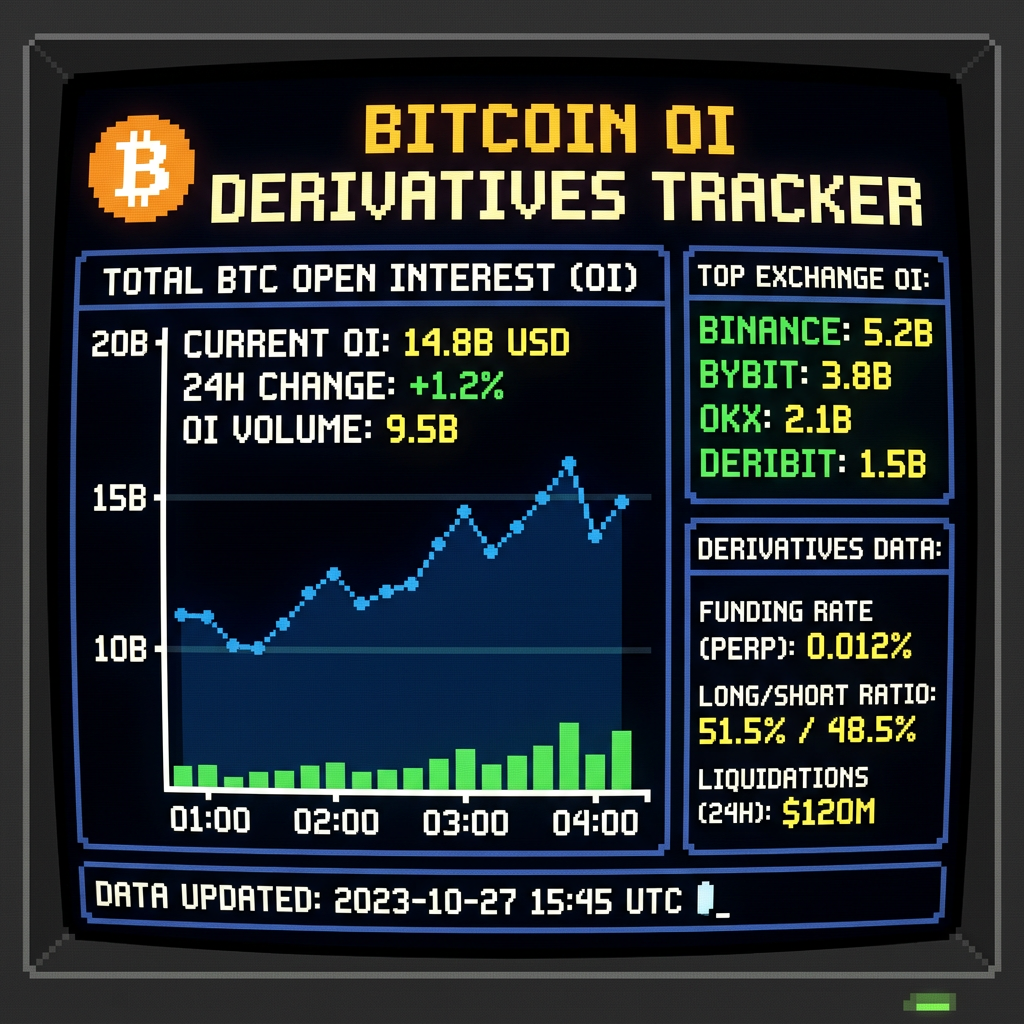
Open Interest is one of the most underused signals in Bitcoin analysis. It measures the total value of all open derivatives contracts — futures and perpetuals — that have not been settled yet. And when you combine it with price action and other onchain metrics, it tells you something that price charts never will: how much leverage is sitting in the market right now, and how much of it could unwind.
What Is Open Interest?
Every time a trader opens a futures or perpetual futures position, they create a contract. Open Interest is the total number (or dollar value) of those contracts that are still open. When a new contract is created, Open Interest goes up. When a contract is closed or liquidated, Open Interest goes down.
Unlike trading volume, which measures how many contracts changed hands in a given period, Open Interest measures how many are still outstanding. Volume is activity. Open Interest is exposure.
Think of it this way: a market with $5B in daily volume but only $2B in Open Interest is different from one with $5B in daily volume and $35B in Open Interest. The second market is far more crowded with open bets. And crowded bets unwind violently when price moves against them.
Why Open Interest Matters for Cycle Analysis
Bitcoin’s three major blow-off tops each had something in common: Open Interest was extremely elevated before they peaked.
In late 2020 and into 2021, Open Interest on Bitcoin perpetuals climbed steadily as price ran from $20K to $64K in April. By the time of the April 2021 correction, OI was over $25B. The correction wiped out over 60% of that open exposure in a matter of days.
The pattern repeated heading into November 2021. BTC was at $69K and Open Interest was approaching $35B. When price rolled over, the cascade of liquidations pushed it to $47K in six weeks — even before the macro environment turned.
The pattern in both cases: high OI at high prices means a crowded market and amplified corrections when the trend reverses.
Open Interest as a Crowding Signal
Elevated OI does not mean a crash is imminent. But it changes the risk profile of a move. Here is how to read it:
OI rising alongside price: More capital is entering the market. Longs are being opened. This can fuel a trend, but it also means that when price turns, there are more positions to unwind. Each liquidation pushes price lower, triggering the next. This is the cascade.
OI declining or flat while price rises: The move is being driven by spot demand, not derivatives leverage. This is a cleaner structure. Less fuel for blow-offs, but also less risk of a leverage-driven correction.
OI rising while price is declining: Short sellers are piling in. If price reverses sharply, those shorts get liquidated to the upside. Short squeezes are born from elevated short OI.
Open Interest and Funding Rates: The Full Picture
Open Interest alone tells you how crowded the market is. But pairing it with funding rates tells you which direction the crowd is leaning.
Funding rates are the periodic payments between longs and shorts in perpetual futures. Positive funding means longs are paying shorts — the market is net long and traders are paying for that bullish exposure. Negative funding means shorts are paying longs.
- High OI + positive funding: The market is crowded long. This is the blow-off setup. A price drop triggers leveraged long liquidations, which accelerates the move down.
- High OI + negative funding: The market is crowded short. A sharp move up squeezes those shorts — the mirror image of the above.
- Low OI + neutral funding: Reduced leverage and no strong directional crowding. This typically characterizes early-cycle or mid-cycle consolidation phases.
What Current Open Interest Readings Tell Us
In April 2026, Bitcoin perpetual Open Interest has remained relatively contained compared to prior cycle peaks. While price has recovered from the Q1 2026 lows of $65K to the $78K range, OI has not expanded aggressively. Funding rates have remained near neutral. This is the structural profile of a market that is not yet overcrowded with leveraged longs.
To put this in historical context: at comparable prices during the 2021 cycle, funding rates were running at 5-10x current levels and OI was significantly higher relative to market cap. The leverage that created blow-off conditions in 2021 is not present at these price levels today.
That does not mean it cannot develop. But the current setup reflects a different structural profile than prior cycle tops.
Combining Open Interest With Onchain Metrics
The most powerful way to use Open Interest is as part of a multi-metric framework, not in isolation. Here is how to pair it with other signals:
With accumulation signals: If onchain accumulation signals are active while OI is low, the setup structurally resembles prior cycle bottoms. Smart money accumulates quietly while derivatives traders are underexposed.
With MVRV Z-Score: When MVRV is in value territory and OI is low, the market has not entered speculative excess. When MVRV approaches overheated readings and OI is elevated, cycle top risk increases significantly.
With cycle top indicators: OI is one of several signals that historically cluster at cycle peaks. No single indicator calls the top. The convergence of multiple signals does. For a full breakdown of what those signals look like, see the 7 Bitcoin cycle top indicators guide.
Open Interest Thresholds to Watch
There is no single OI number that signals danger, because Bitcoin’s market cap changes cycle to cycle. But proportional readings help. In the 2021 cycle, OI-to-market-cap ratios peaked well above 3%. Current readings are meaningfully lower.
The combination to watch for: OI expanding rapidly while MVRV moves above 3.0, funding rates becoming persistently elevated (above 0.05%/8h on perpetuals), and price making new highs with declining spot volume. That combination is a warning system worth monitoring.
Summary: How to Use Open Interest
Open Interest is a derivatives-layer signal that measures market crowding. High OI with elevated funding means crowded longs and amplified downside if price turns. Low OI with neutral funding means a less crowded, structurally cleaner setup.
It does not replace onchain signals. It complements them. A complete Bitcoin market picture includes spot behavior (exchange reserves, MVRV, RHODL), holder behavior (CDD, STH-SOPR, HODL Waves), and derivatives structure (OI, funding rates).
Right now, the derivatives layer is not reading like a cycle top. OI is contained. Funding is neutral. The leverage-driven blow-off conditions that historically preceded Bitcoin’s major peaks are not present at these price levels.
That is the signal. Not a prediction. Just what the data says.


Leave a Reply