
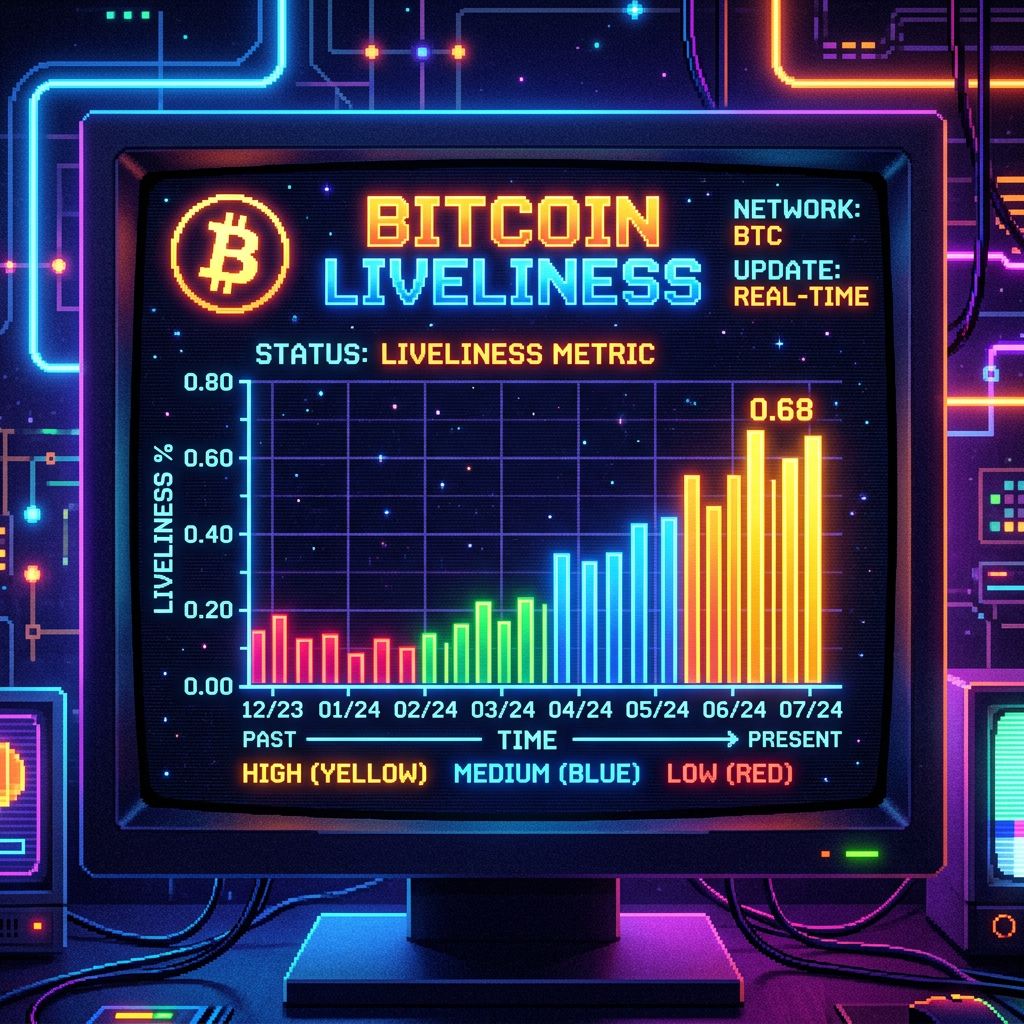
Most Bitcoin onchain metrics answer the question: where did coins move, and at what price? Liveliness asks a different question. It asks: how much of Bitcoin’s total economic weight is actively moving, versus aging quietly in cold storage?
That distinction turns out to be surprisingly powerful for reading where we are in a market cycle.
What Is Bitcoin Liveliness?
Liveliness is a metric developed by Glassnode that measures the ratio of Coin Days Destroyed (CDD) to total coin days created over the lifetime of the Bitcoin network.
Here is how to think about it:
- Every Bitcoin accumulates “coin days” at a rate of 1 per coin per day it sits unspent.
- When a coin moves, those accumulated days are destroyed. That is CDD.
- Liveliness = cumulative CDD / cumulative coin days created.
The result is a number between 0 and 1. When Liveliness is rising, more coin days are being destroyed than created, meaning older coins are moving. When Liveliness is falling, coins are aging faster than they are being spent, meaning holders are accumulating and sitting still.
Liveliness vs. Vaultedness
Liveliness has a direct complement: Vaultedness. The formula is simple:
Vaultedness = 1 − Liveliness
When Liveliness falls, Vaultedness rises. These two metrics are part of the broader Cointime Economics framework, which treats Bitcoin not just as a monetary asset but as a time-weighted one. A coin that has been held for three years carries more economic weight than a coin that was just bought and sold within the same week.
Vaultedness rising is a signal that the supply is maturing. Coins are being taken out of circulation and stored. That is not neutral information. It is a structural shift in holder behavior.
What Rising and Falling Liveliness Signal
The key insight is that Liveliness behaves asymmetrically across bull and bear markets.
Liveliness rises when:
- Long-term holders begin distributing. Old coins move after years of dormancy.
- CDD spikes. This typically occurs during late-stage bull markets when early holders sell into strength.
- Speculation dominates. Short-term coins churn at high rates because traders are active.
Liveliness falls when:
- Long-term holders are accumulating and holding. Coins are aging, not moving.
- CDD is suppressed. Old holders show no desire to sell at current prices.
- Conviction capital is dominant. Supply is migrating from active traders to patient holders.
This behavioral picture cannot be read from price alone. Price tells you what the market cleared at. Liveliness tells you who is doing the clearing and how patient they are being about it.
Historical Patterns: What Liveliness Has Shown at Cycle Tops and Bottoms
Looking back at Bitcoin’s cycle history, Liveliness has a clear behavioral pattern around major market turns.
At the 2017 cycle top (December 2017, $19,000): Liveliness was rising sharply. Early Bitcoin holders who had accumulated during the 2015-2016 bear market were moving their coins into the market. CDD spiked. Supply that had been dormant for years started flowing. This is the distribution signature.
During the 2018-2019 bear market: Liveliness fell steadily. Weak hands had already sold. The remaining supply was held by conviction holders who refused to move at depressed prices. Coins were aging. Vaultedness was rising.
At the 2021 cycle top (November 2021, $69,000): Liveliness was elevated and rising. The same pattern: long-dormant supply moving into an overheated market. CDD was spiking for weeks before the top. The data was signaling distribution before price confirmed it.
Through Q1-Q2 2022 (capitulation): Liveliness declined sharply. Supply locked up. Fear drove selling from short-term holders, but long-term holders stood pat. By late 2022, Liveliness had reached multi-year lows.
The pattern is consistent across cycles: rising Liveliness = old supply mobilizing, often near tops. Falling Liveliness = old supply accumulating or holding, often near bottoms or mid-cycle consolidations.
How Liveliness Relates to HODL Waves and CDD
Liveliness does not exist in isolation. It connects directly to two other metrics that tell a similar story from different angles.
Coin Days Destroyed (CDD) is the raw input. Every time Liveliness spikes, the underlying cause is a CDD event: old coins moving. But CDD is noisy. A single whale moving 50,000 BTC dormant since 2013 creates a massive CDD spike that distorts the daily reading. Liveliness smooths this by looking at the cumulative ratio over the entire history of the network.
HODL Waves shows the age distribution of unspent Bitcoin. When the 12-month-plus bands are dominant, it means most supply has not moved in over a year. That is the same structural story as suppressed Liveliness: the coins are old and staying put. HODL Waves gives you the snapshot; Liveliness gives you the trend.
Together, these three metrics: CDD, HODL Waves, and Liveliness: give a complete picture of holder behavior. They answer: how old is the supply, how much old supply is moving, and is that movement accelerating or decelerating?
Where Liveliness Stands in May 2026
As of late May 2026, Bitcoin Liveliness remains suppressed. This is consistent with what CDD has been showing: old coins are not moving. Despite Bitcoin recovering from the Q1 2026 drawdown and trading near $78,000, the long-term holder cohort has not used this price recovery as a distribution opportunity.
Vaultedness is rising. The supply that exists on the Bitcoin blockchain is aging. Coins are accumulating more coin days rather than having them destroyed.
Compare that to what Liveliness looked like in the final months of 2021: rising sharply as early holders rotated out into the market near $60,000-$69,000. The behavioral picture today is structurally different. Long-term holders are not distributing. They are waiting.
That is not a price prediction. It is what the data shows. Suppressed Liveliness has historically been associated with accumulation phases and mid-cycle consolidations, not with the final legs of cycle tops. Tops tend to come with a Liveliness spike, not a Liveliness floor.
How to Use Liveliness in Your Onchain Framework
Liveliness is a confirmation tool, not a standalone trigger. Here is how to integrate it practically:
- Watch for trend direction. A steadily falling Liveliness over weeks and months indicates maturing supply. A reversal upward, especially combined with a CDD spike, is worth paying attention to.
- Pair it with MVRV Z-Score. Suppressed Liveliness plus low MVRV is a powerful combination: old supply not moving, and the market is not overheated. Both metrics agreeing is signal. Either metric alone is weaker.
- Check Vaultedness trend. If Vaultedness is rising month-over-month, that is structural accumulation. Supply is being removed from active circulation and placed in deep storage.
- Use it to frame tops, not bottoms. Liveliness is more useful as a warning signal near tops: when it starts rising into an already elevated MVRV environment: than as a precise bottom caller. The bottoms are often identified more cleanly by MVRV, Reserve Risk, or STH-SOPR.
The Bottom Line
Liveliness is one of the cleanest behavioral gauges in onchain analysis. It does not care about price. It does not care about the news cycle. It only tracks one thing: whether the long-term holder cohort is aging their coins or spending them.
When Liveliness is suppressed and Vaultedness is rising, the data is saying that patient capital is in control. The supply is maturing. Old holders are holding.
When Liveliness spikes and CDD surges, the data is saying that old supply is hitting the market. That is typically a late-cycle signal, not an early one.
Understanding the difference between those two states is what separates data-driven analysis from price-chart noise. Right now, in late May 2026, the data is pointing at the first state. The coins are aging. The conviction capital is holding. That is the story Liveliness is telling.
Common questions
What does liveliness actually measure? The ratio of coin days destroyed to coin days created over the network’s life. Rising liveliness means old coins are being spent faster than supply is ageing; falling liveliness means holders are accumulating and sitting still.
Why use a cumulative ratio? Because it removes the scale problem. Raw coin days destroyed grows with the size of the network, so it cannot be compared across years. Liveliness is bounded between 0 and 1 and is comparable across the whole history.
What does a falling reading mean in practice? Supply is moving into hands that do not spend it. That reduces available float, which is a supply observation rather than a demand one, and it says nothing about whether buyers will arrive.
Leave a Reply