
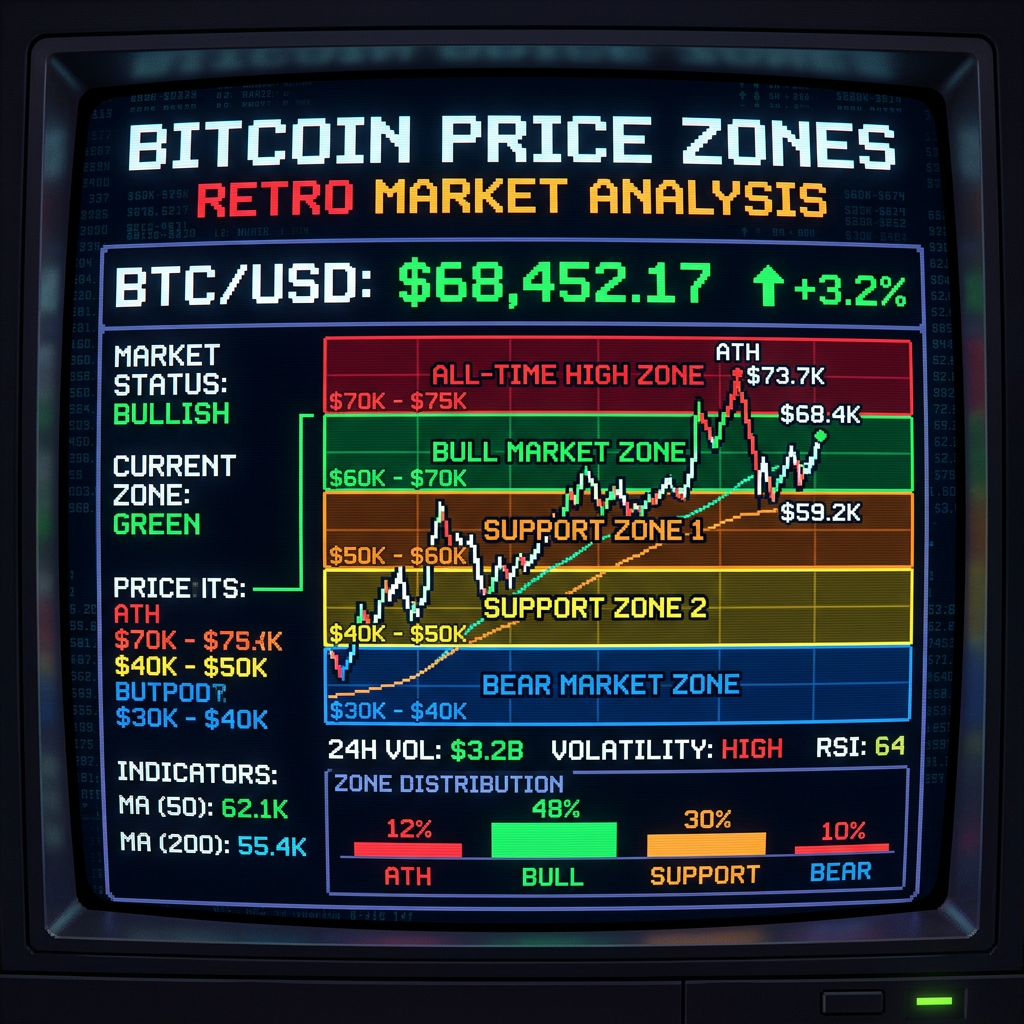
Bitcoin is trading at $73,381 as of May 28, 2026. That puts us right back in the $70K zone — the same range that produced some of the most interesting holder behavior data of this entire cycle.
Studying how Bitcoin holders actually behaved at three key price levels reveals patterns that repeat. At $70K, at $100K, and at $120K, the onchain data told very different stories. Here is what the metrics showed.
Why Holder Behavior Matters
Price is what traders see. Holder behavior is what the blockchain records. Every time a coin moves, it leaves a timestamp and a cost basis. Those records let analysts reconstruct exactly what holders were doing at any price level: accumulating, holding, or distributing.
The key metrics for this analysis are MVRV Z-Score (unrealized profit across all holders), STH-SOPR (realized profit or loss for short-term holders), Exchange Reserves (supply available to sell), and Coin Days Destroyed (long-term holder movement). Each tells a different part of the story.
$70K: The Accumulation Zone
The $70K range emerged as a consistent accumulation zone in late 2024 and again in early-to-mid 2025. Every time price touched this level, the same signals lined up.
MVRV Z-Score stayed neutral. At $70K, the MVRV Z-Score sat in the 1.0 to 1.5 range, well below the danger zone above 3.0. The average Bitcoin holder had moderate unrealized profit, not excessive. This is the signature of a market that has corrected but has not reset to deep undervaluation.
STH-SOPR dipped below 1.0. Short-term holders (coins moved in the last 155 days) were spending their coins at a loss at $70K. When STH-SOPR falls below 1.0, it means recent buyers are capitulating: selling at a loss after buying higher. Historically, sustained STH-SOPR below 1.0 marks the late stage of a correction, not the beginning of a crash.
Exchange reserves kept falling. Throughout the $70K range, the total Bitcoin balance on exchanges continued declining. Holders were withdrawing, not depositing for sale. This is the clearest accumulation signal on the blockchain.
Long-term holders did not move. Coin Days Destroyed stayed suppressed. Wallets holding Bitcoin for six months or more were dormant. Old coins were not being sent to exchanges. The patient money was sitting still.
$100K: The Consolidation Test
Bitcoin’s run through $100K was historic. But the onchain data showed that $100K was not a clean breakout — it was a test of conviction.
MVRV Z-Score climbed into caution territory. At $100K, the MVRV Z-Score pushed into the 2.0 to 2.5 range. The average holder was sitting on significant unrealized profit. Past cycles show this range produces mixed behavior: some holders sell into strength, others hold for higher. Neither side dominates at first.
STH-SOPR moved well above 1.0. Short-term holders were realizing profits. This is natural and healthy at new all-time highs. The question is whether profit-taking overwhelms new demand. At $100K in late 2024, demand absorbed the selling and price consolidated rather than reversing sharply.
Exchange reserves saw modest inflows. Some coins moved to exchanges as holders took profits around $100K. But the inflows were measured, not a flood. This is what healthy consolidation looks like onchain: selling pressure present but not dominant.
Long-term holders started moving. Coin Days Destroyed picked up at $100K. Wallets dormant for one to three years began to show activity. This is the classic LTH distribution signature at new price highs: not panic, not a crash, just gradual top-of-range selling by patient holders who have been waiting years for these prices.
$120K: The Distribution Zone
Bitcoin’s push above $110K and toward $120K represented the cycle peak to date. The onchain data at those levels told a starkly different story from the $70K accumulation zone.
MVRV Z-Score hit cycle extremes. At $120K, the MVRV Z-Score entered the 3.0 to 3.5 range, historically associated with cycle peaks and significant distribution events. The average Bitcoin holder was sitting on unrealized gains of 3x or more relative to the realized price of all coins. These readings do not automatically mean a top, but they narrow the margin for error considerably.
STH-SOPR ran hot for weeks. Extended periods of STH-SOPR above 1.2 mean short-term holders are consistently realizing large profits. When this persists for weeks rather than days, it signals that demand is still absorbing supply but the market is working hard to do it.
Exchange reserves stopped falling. The multi-month trend of declining exchange balances paused and briefly reversed near $120K. Holders were depositing coins for sale. Not a massive reversal, but a notable stall in what had been a sustained drawdown.
Coin Days Destroyed spiked sharply. CDD exploded at $120K. Very old coins, some dormant for five years or more, moved for the first time. This is the strongest distribution signal available. Long-term holders who had accumulated at $10K, $20K, and $50K were finally selling into cycle highs. The scale of CDD at $120K was comparable to previous cycle tops in 2017 and 2021.
What the Data Says Right Now at $73K
With Bitcoin at $73,381 today, we are back in the accumulation zone range. The onchain pattern from the $70K levels earlier in this cycle is a useful reference point.
MVRV Z-Score is back below 2.0. Short-term holders are under pressure. Exchange reserves remain at structurally low levels. Long-term holders are not distributing at scale. These are the same conditions that preceded the run to $100K and then $120K.
That does not mean the path is guaranteed. Onchain data shows intent and cost basis — it does not predict price. But the three snapshots of holder behavior at $70K, $100K, and $120K give a framework for reading what the market is actually doing, not just where price is ticking.
The current data reads like an accumulation phase, not a distribution one. The divergence between the two is rarely this clear. For the latest five-metric snapshot, see the Weekly Onchain Watch #7. For a deeper look at why onchain analysis beats price-only thinking, read why onchain data beats technical analysis.


Leave a Reply